Analytics
Explore traffic, theme, and sales performance charts to support business decisions.
Overview
The Analytics module visualizes business data through 10 ECharts charts, covering prospect traffic behavior and sales team performance.
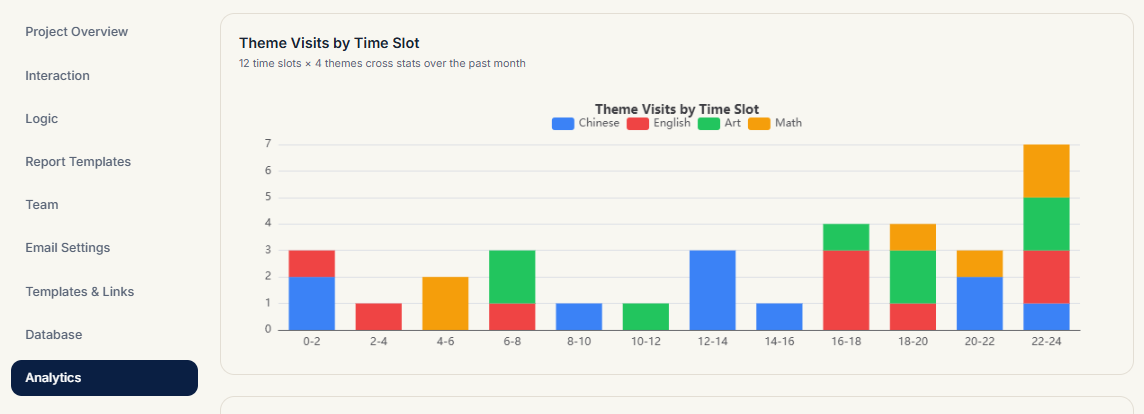
Chart List
| # | Chart | Metric | Plan |
|---|---|---|---|
| 1 | Weekly visits | Past week, by weekday | Free |
| 2 | Visit timezone distribution | Past week, in 2-hour buckets | Pro+ |
| 3 | Monthly visits | Past 13 months, by month | Pro+ |
| 4 | Quarterly visits | Q1–Q4 stats | Pro+ |
| 5 | Yearly visits | By year | Pro+ |
| 6 | Theme visits | Past month, by theme | Pro+ |
| 7 | Theme × timezone visits | 12 buckets × 4 themes | Pro+ |
| 8 | Projects handled by manager | Manager × status (Won/Lost/Follow-up) | Pro+ |
| 9 | Themes handled by manager | Manager × theme | Pro+ |
| 10 | Avg. response time by manager | Manager avg. reply hours | Pro+ |
Usage Notes
- Chart 1 is visible for free; charts 2–10 require Pro / Max (locked in the MVP)
- Hover charts for values; they adapt automatically on window resize
- Data updates daily; the latest inquiries and follow-ups are reflected in the stats